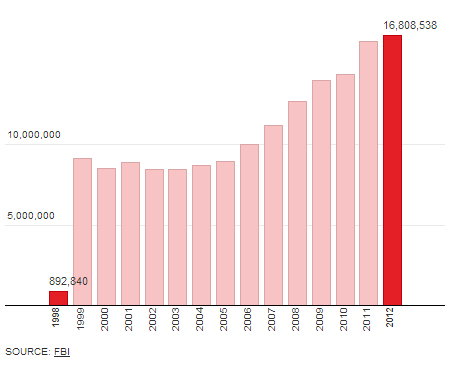
There is no record of the exact total guns that have been sold in the United States, but we can get an idea by the amount of background checks performed using the FBI Criminal Background Check System. The data shows the number of applications there are to buy firearms for each year, and it seems that this year we continue to see a continued increase in gun sales across the United States.
With a number of gun related tragedies and incidents just this year, it is no surprise that more and more people are purchasing firearms. The recent Connecticut Elementary School shooting and Aurora Cinema Massacre, being among the worst gun related murders in the US, there is also renewed interest in gun control laws across the country.
How the current system works is that when an individual wishes to purchase a firearm, the gun store calls in a background check request to the FBI or other affiliated agencies, and gets a reply on whether or not the customer is eligible to make the purchase, most are denied due to previous criminal records, mental health issues, and other factors.
The data below shows that there has been 16,808,538 applications in 2012 from January to November. Doing justice to the fact that the United States has the highest number of gun owners in the world.

If you are surprised by the numbers, keep in mind that not all of the applications are approved. Numerous factors are looked at before an approval, and being convicted of a crime in the last two years counts for 58.65% of the denials this year.
| NICS applications by state | |||
|
STATE
|
TOTAL APPLICATIONS NOV 1998 TO NOV 2012
|
TOTAL Jan to Nov 2012
|
2012 Rate per 1,000 population
|
|
SOURCE: FBI
|
|||
| These statistics represent the number of firearm background checks initiated through the NICS. They do not represent the number of firearms sold. Based on varying state laws and purchase scenarios, a one-to-one correlation cannot be made between a firearm background check and a firearm sale. | |||
| UNITED STATES | 156577260 | 16808538 | 53.94 |
| Alabama | 3749099 | 350780 | 73.3 |
| Alaska | 714007 | 72904 | 102.09 |
| Arizona | 2675937 | 290868 | 45.35 |
| Arkansas | 2514731 | 207363 | 70.98 |
| California | 10714573 | 981798 | 26.29 |
| Colorado | 3736952 | 361385 | 71.59 |
| Connecticut | 1810014 | 208250 | 58.24 |
| Delaware | 256059 | 25098 | 27.89 |
| District of Columbia | 2170 | 398 | 0.66 |
| Florida | 5957840 | 699974 | 37.16 |
| Georgia | 4559627 | 386562 | 39.8 |
| Guam | 5934 | 819 | |
| Hawaii | 121737 | 15414 | 11.31 |
| Idaho | 1243607 | 115927 | 73.79 |
| Illinois | 8399271 | 923920 | 71.95 |
| Indiana | 3300627 | 404259 | 62.28 |
| Iowa | 1530528 | 128293 | 42.06 |
| Kansas | 1673605 | 175427 | 61.36 |
| Kentucky | 15118518 | 2329151 | 535.78 |
| Louisiana | 2987951 | 266593 | 58.65 |
| Maine | 790550 | 79418 | 59.83 |
| Mariana Islands | 296 | 5 | |
| Maryland | 1239350 | 117432 | 20.3 |
| Massachusetts | 1567707 | 185202 | 28.25 |
| Michigan | 4817185 | 370960 | 37.56 |
| Minnesota | 3516313 | 385075 | 72.51 |
| Mississippi | 2390007 | 180121 | 60.65 |
| Missouri | 3804462 | 432060 | 72.06 |
| Montana | 1253675 | 115893 | 116.95 |
| Nebraska | 742160 | 70454 | 38.5 |
| Nevada | 1076544 | 123943 | 45.83 |
| New Hampshire | 894061 | 108531 | 82.42 |
| New Jersey | 634408 | 75804 | 8.61 |
| New Mexico | 1338322 | 121882 | 59 |
| New York | 2849970 | 290299 | 14.97 |
| North Carolina | 4427820 | 415284 | 43.44 |
| North Dakota | 590720 | 73878 | 109.51 |
| Ohio | 4918014 | 526684 | 45.65 |
| Oklahoma | 2841850 | 307245 | 81.71 |
| Oregon | 2347894 | 222795 | 58.04 |
| Pennsylvania | 8156636 | 835293 | 65.68 |
| Puerto Rico | 115421 | 13772 | 3.7 |
| Rhode Island | 169915 | 20180 | 19.17 |
| South Carolina | 2320334 | 265276 | 57.21 |
| South Dakota | 744106 | 73658 | 90.2 |
| Tennessee | 4166503 | 432200 | 67.98 |
| Texas | 11724997 | 1196176 | 47.37 |
| Utah | 2967949 | 198091 | 71.37 |
| Vermont | 310812 | 29662 | 47.39 |
| Virgin Islands | 9320 | 370 | |
| Virginia | 3524638 | 371267 | 46.27 |
| Washington | 3631035 | 444762 | 65.96 |
| West Virginia | 2059912 | 191550 | 103.3 |
| Wisconsin | 2974560 | 413842 | 72.71 |
| Wyoming | 587027 | 53480 | 94.73 |
68,584,078 of the total applications since 1998 have been for ‘long guns’ such as rifles, usually a minimum length of 16 inches (40 cm) for rifle barrels – that is 43.8% of all applications. Kentucky has the highest rate of 2,329,151 and Texas comes in second with 1,196,176 applications.

